A Packet Sniffer or HTTP/JavaScript Debugger as it is known is a tool that analyzes and parses network traffic. There are many other uses of a Packet Sniffer but in this case we are only looking at capturing HTTP/JavaScript packets. So if I have a webpage containing Google Analytics code, all I need to do is activate this software while the webpage is being loaded. Once the entire code snippet on the page has been loaded, you can go to the Packet Sniffer tool and search for the Google Analytics code from the list of captured packets.
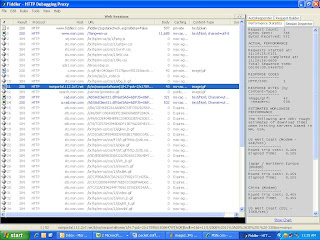
Let us look at an example by going to www.msn.com and capturing the Omniture Web Analytics tag on their webpage using a tool called Fiddler. Please look at the 2 screenshots captured after the MSN-US page load was complete.

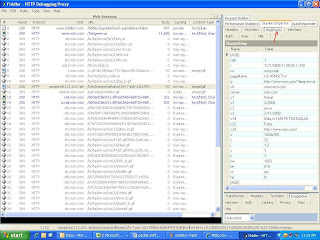
The first image is an overall summary of all the code being rendered with the Omniture code highlighted in Blue. Please note that for an Analytics JavaScript code to be successfully rendered, it has to make a ‘Status 200' call to the respective Datacenter meaning the request has been completed. Now double click on the captured snippet and look at the second screenshot for the next step.

After double clicking on the Omniture code, you will have to click on the Web Forms tab on the top right in order to view the various parameters being passed onto Omniture. You will notice all the various parameters being sent to Omniture like the Page name, Language, Screen resolution and so on. This step will also tell us whether the custom variables we passed on the analytics code are being sent correctly or not.
Packet Sniffers have a very important role to play in Web Analytics as they can help fix issues like data not being present in the reports to discrepancy in numbers. Finally listed below are a few more HTTP Debugger tools that I’m aware of:
1) Adobe Experience Cloud Debugger
2) Charles Proxy
3) Debugger for Adobe Analytics
4 comments:
There is a firefox plugin called 'Tamper Data' which is extremely helpful.
As an aside, our tag code (WebAbacus) includes a debug mode, whereby all captured information is displayed in a layer at the top of the page. This remains in place, until you choose to stop the debug mode - this can be extremely helpful when trying to debug commerce value capture.
The price for HttpWatch starts from $395, there are some other good http analyzers. For example http debugger ($50) http://www.httpdebugger.com or fiddler (free) www.fiddlertool.org.
There are some other good http traffic debuggers.
For example http debugger ($50) http://www.httpdebugger.com or fiddler (free) http://www.fiddlertool.org.
You should try WASP (immeria.net). This was found out especially for such purposes.
Post a Comment